
Cyber risk quantification
If you can’t measure your risk, you can’t manage it.
We measure cyber and IT risk in financial terms. Security findings become a figure your investment committee or board can act on.
No target cooperation needed to start.

Priced in money terms
Cyber risk as a number you can take to the board.
Known before the deal
See the exposure before the capital is committed.
Defensible in the room
A figure that holds up to the first hard question.
Kept current
See what moved across the portfolio each quarter.
One figure shows which target carries the risk.
Watch how a shortlist of targets becomes figures your committee can compare.
Your assessment
One figure, and everything behind it.
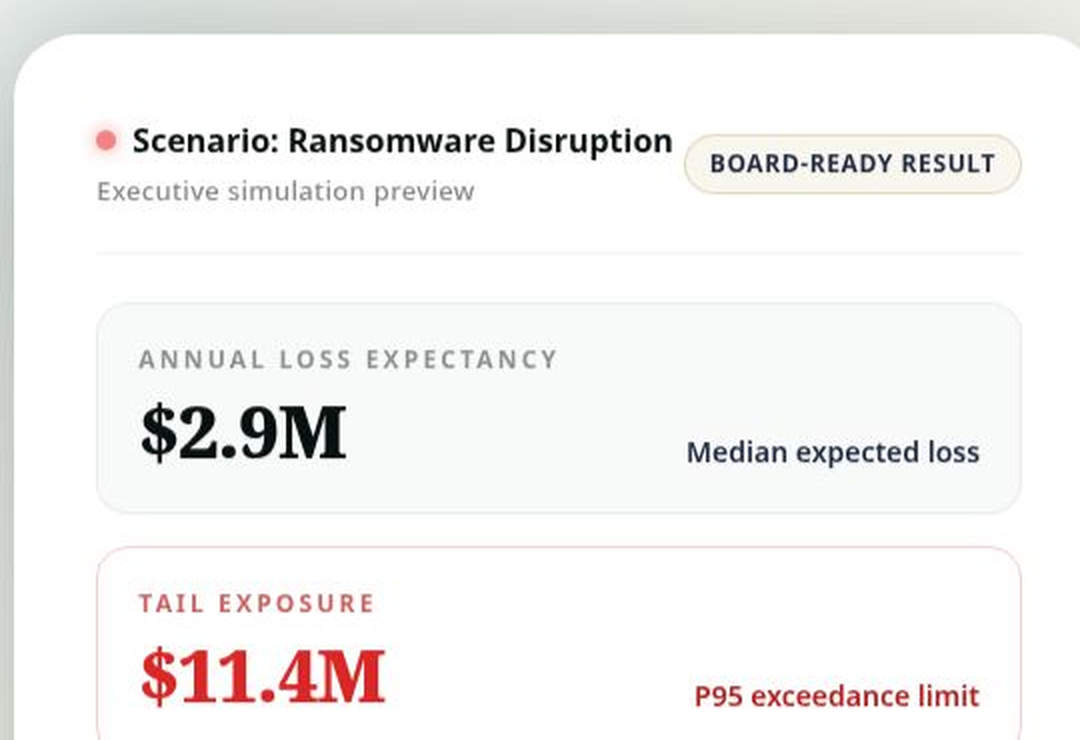
Every assessment lands in money terms, with a realistic case and a bad case, and is reviewed before delivery.
- Annual loss expectancy
- The probable yearly cost of cyber incidents for the business in question.
- Bad case
- The loss at the 95th percentile, for the question the committee will ask.
- Scenario drivers
- Which threats carry the exposure, ranked by what they cost.
- Treatment ROI
- What each control removes, set against what it costs.
- Regulatory mapping
- Aligned to NIS2, DORA, the SEC Cyber Rule and ISO 27005.
- Next step
- The action that moves the figure most, in order of impact.
Exposure brief
Target screening, example company
Exposure by scenario
Top treatment
Immutable backups with tested restore. Removes an estimated $0.9M a year.
Frameworks
Next step
Full due diligence on ransomware and third party exposure before signing.
Example report. Figures are illustrative; yours are modelled from your target.
What we do
Whatever decision you’re making, there’s a number behind it.
Target screening
An early read on a target’s cyber exposure before diligence budget is committed.
Learn more 02Transaction due diligence
A full assessment of what a cyber incident could cost, built for the investment committee decision.
Learn more 03White label supply
Advisory firms offer quantified cyber risk under their own brand, without building the capability in house.
Learn more 04Portfolio monitoring
Quarterly re-quantification keeps exposure figures current across a portfolio, not only at close.
Learn moreShortlist screening
5 targets, one method
Annual loss expectancy
Speed
Screen a full shortlist, not just the front runner.
No target cooperation is needed to start, so several candidates can be reviewed in parallel instead of the one or two names a traditional review has time for.
- An early read before diligence budget is committed
- Every target measured the same way
- The outlier is visible at a glance
The platform
Every figure is produced on Risqua, not in a spreadsheet.
Each scenario runs thousands of Monte Carlo iterations to a probable annual loss and an uncertainty range.
- A realistic case and a bad case, never a single point
- Treatment ROI weighed against control cost
- Board-ready reporting from the same run
Portfolio monitoring
Exposure by quarter
Example. Portfolio annual loss expectancy, scale from zero.
Consistency
Keep exposure current, not a one-time snapshot.
Re-quantify portfolio companies every quarter and see what moved, instead of relying on a diligence report from two years ago.
- Quarterly re-quantification
- What moved, and why
- The same method at close and after
Insights
Recent thinking on cyber and IT risk.
See it first
Read a finished assessment before commissioning one.
Pick the decision you’re facing: screening, due diligence, white label or portfolio monitoring. We’ll send a finished assessment of that type.
Request a sample